

US-China trade war intensifies but some resolution not ruled out

Colin Ng
Head of Asia Equities

Paul Ho
Head of Investment Technology
Manager Comments
Tariff announcement has not lifted the market uncertainty
Contrary to hopes that Trump’s latest tariff announcement puts an end to policy uncertainties, we expect doubt and confusion to linger.
President Trump has paused his reciprocal tariffs for most of the US’s trading partners although the list is yet to be confirmed. What is clear is that the US trade war with China not only continues but is set to deepen, with US duties on Chinese imports raised to 125 percent, and Chinese duties on US imports raised to 84 percent1
But even the lifting on threatened tariffs against other Asian countries does not mean an end to the uncertainties. The tariffs on imported autos, steel, aluminum, lumber and pharmaceuticals still remains for now, while the scope of tariff exemptions for semiconductors is still unclear.
Overall, a decline in global trade volumes and in turn a slowdown in global growth and aggregate company earnings remain on the cards. As with any policy announcement, it will take several months for their full impact and implementation to become evident.
China levers
While it would appear that China is now more isolated in its trade war with the US, we think that the country has the following levers to reduce the impact on its economy:
- China has faced escalating US tariffs since Trump’s first term and is better positioned to deal with these. The market is eagerly awaiting the announcement of a stimulus package to boost domestic consumption.
- China is the world’s largest goods producer. Its manufacturing output in 2024 was US$5.65 trillion, more than double that of the US and more than five times that of Japan and Germany2
- China is the dominant producer of rare earth metals. The supply of these cannot be meaningfully sourced outside of China and Russia, and they are critical for the manufacture of products such as military defence equipment and semiconductor materials required for advanced semiconductor chips.
- In recent years, China’s President Xi has adopted a more assertive foreign policy stance, including support for Russia. Regardless of the current trade spat, on the diplomatic front, China and the US remain “frenemies”.
These economic and geo-political levers cause us to be wary of assertions that the US and China are headed for a total “decoupling”. There are no winners in a trade war, and in our view, both countries are open to negotiations to defuse the current trade standstill.
We continue to seek China opportunities
Despite the recent sell off, we remain positive on selective China tech and consumer related stocks in the medium to long term. We believe that these sectors will benefit from a structural growth trend and remain profitable even in the midst of a US-China trade war. We also see good prospects for Chinese companies that are able sustain their competitive edge over the next couple of years.
Cautious on Taiwan/ India in the short term
We like Taiwan over the long term but at this point, we think that the risk reward is less attractive vis-à-vis the other Asian markets. Taiwan semiconductor companies are poised to benefit from the boom of AI globally and potential US tariff exemptions, but many of the stocks have run up a little ahead of their fundamentals. As such, their share prices have the potential to correct a little more before becoming attractive again.
The same can be said for India, which is one of the most domestically driven economies and should be resilient to external shocks. However, we have said for quite a while that valuations there are a concern. At current valuations, there is little room for disappointment. We think there will be future opportunities to increase our weights in this market after a more meaningful correction.
Korea structurally challenged but present tactical opportunities
Korea’s traditionally competitive industries are facing serious competition from neighboring countries – in particular, from China, Taiwan and US in relation to its semiconductor sector, and from China in relation to autos and shipbuilding. As the economy slows and consumer debt builds up, we expect domestic consumption to remain vulnerable.
Trump tariffs are also expected to do real damage to the Korean economy. The country has one of the largest trade surpluses with the US and is one of the so-called “Dirty 15” countries3.
That said, we will be tactically reducing our underweight in Korea this month, given select opportunities in the tech and financial sectors. The selldown in these sectors appears overdone and Korean semiconductor exports may have bottomed amid a recovery in memory chip prices.
ASEAN withstood March’s turbulence
ASEAN once again displayed its defensive nature with the MSCI Asean index registering a positive 1.1 percent return in March4. The panic in the Indonesian market saw a dramatic turnaround and managed to close the month in positive territory. Otherwise, Singapore, Malaysia, Thailand and the Philippines performed relatively well amid the turbulence in global markets.
AI-Augmented Asia Solutions

United Asia Fund
Performance: 0.98 percent excess returns in March
| 1M | 1Y | 3Y | |
| United Asia Fund | 0.66% | -3.61% | 0.04% |
| Benchmark | -0.32% | 10.89% | 1.56% |
Source: Morningstar. Performance as of 31 March 2025, SGD basis, with dividends and distributions reinvested, if any. Fund refers to United Asia Fund – A SGD Acc. Benchmark: April 1992 – December 2011: MSCI AC FE ex-Japan; January 2012 to present: MSCI AC Asia ex-Japan. Performance figures for 1 month till 1 year show the per cent change, while performance figures above 1 year show the average annual compounded returns.
- The Fund was up 0.7 percent in the month of March, compared to a -0.3 percent decline in the benchmark, as Asian markets turned nervous in the run-up to “Liberation Day”.
- This outperformance was driven largely by our stock picks in China, and our underweight in Taiwan and Korea.
- The biggest detraction in performance came from our underweight in India. The market rebounded from its selldown in February to become the best performing market in March.
Rebalancing: Higher China allocation, reduced India underweight
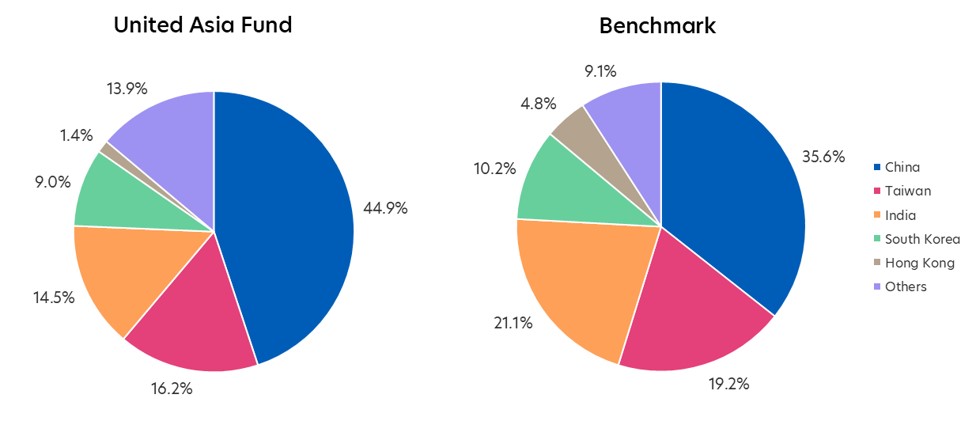
Source: Morningstar. Portfolio rebalancing as of 31 March 2025. Benchmark allocation as of 31 March 2025
- Given the outperformance of our China holdings relative to the rest of the portfolio, our China allocation has drifted up to about 10 percent above the benchmark weight.
- Our analyst research suggests maintaining this new higher allocation, although we have made some adjustments to our portfolio stocks and weights by drawing on our AI-driven optimization process.
- The AI model’s allocation to Indian stocks is around 5 percent less than the benchmark. As India’s weight in the portfolio has drifted below this level, we have taken steps to bring the allocation closer to that recommended by the model.
- Korea’s weight in the portfolio has also fallen below that recommended by the AI model. As such, we have adjusted the Korea allocation upwards by adding to tech and financial sectors. We are now just 1.5 percent underweight relative to the benchmark.
- Given Malaysia’s defensive nature, we have increased our Malaysia allocation to now 4.4 percent higher than the benchmark.

United Greater China Fund
Performance: 1.98 percent excess returns in March
| 1M | 1Y | 3Y | |
| United Greater China Fund | -1.32% | 2.76% | 0.34% |
| Benchmark | -3.30% | 24.19% | 2.75% |
Source: Morningstar. Performance as of 31 March 2025, SGD basis, with dividends and distributions reinvested, if any. Fund refers to United Greater China Fund – A SGD Acc. Benchmark: MSCI Golden Dragon Index. Performance figures for 1 month till 1 year show the per cent change, while performance figures above 1 year show the average annual compounded returns.
- The Fund returned -1.3 percent last month, outperforming the benchmark which fell by -3.3 percent
- The Fund benefitted from its underweight position in Taiwan and overweight position in China.
- Our recent China additions such as BYD, Xiaomi and Pop Mart have contributed meaningfully to our portfolio returns since their inclusion.
- Our underweight position in Taiwan is a short term call on the relative risk reward potential of the stocks there. We remain positive on Taiwan’s semiconductor related stocks and their global competitiveness. However, the short term correction in US tech stocks is expected to have a negative impact on the performance of Taiwan tech stocks.
Rebalancing: Slight further reduction in Taiwan tech
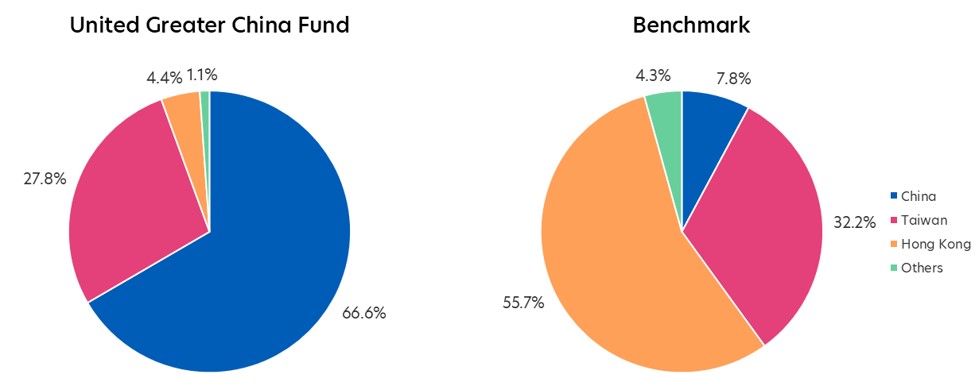
Source: Morningstar. Portfolio rebalancing as of 31 March 2025. Benchmark allocation as of 31 March 2025
- We have further reduced our weight in Taiwan tech this month by a small amount and made some adjustments to our holdings in China.

United SG Dynamic Income Fund
Performance: 1.11 percent excess returns in March
| 1M | 1Y | 3Y | |
| United SG Dynamic Income Fund | 1.47% | 2.50% | - |
| Benchmark | 0.36% | 5.21% | - |
Source: Morningstar. Performance as of 31 March 2025, SGD basis, with dividends and distributions reinvested, if any. Fund refers to United SG Dynamic Income Fund – A SGD Acc. Benchmark: Singapore Overnight Rate Average (SORA) Index +2%. Performance figures for 1 month till 1 year show the per cent change, while performance figures above 1 year show the average annual compounded returns.
- The Fund was up 1.47 percent in the month of March, outperforming the benchmark (SORA + 2 percent) which was up 0.36 percent.
- We benefitted from our call to overweight SG REITs, SG Equities and Asia Equities. These were the month’s best performing asset classes in that order. The decision to take some profit from SG Equities in order to fund a larger overweight in SREITs also added value.
Rebalancing: Small shift from SG REITS to SG Equities
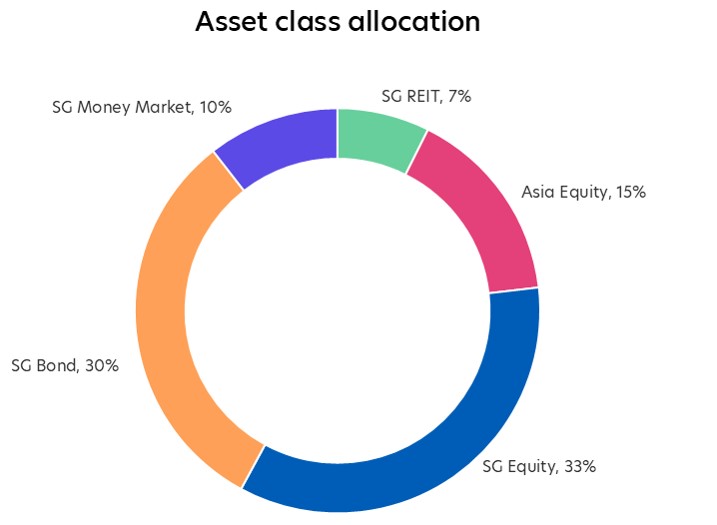
Source: UOBAM, as of 31 March 2025. Note: Cash allocation at 5%
- The Strategy Committee remains cautious on the outlook for global equities and recommended only a slight overweight.
- As such, we have moderated our positive stance on equities (55 percent allocation to equities in total) and have shifted our equities exposure from SG REITS to SG Equities.
For more details on the funds above, check out the respective Monthly Fund Commentaries.
1Source: Trump orders 90-day pause on new tariffs except for China, CNN, 9 April 2025.
2Source: UOBAM, as of Feb 2025.
3Source: The 'Dirty 15' economies that could be hardest hit by Trump's reciprocal tariffs, Channel NewsAsia, 1 April 2025.
4Source: MSCI, as of 31 March 2025.
| If you are interested in investment opportunities related to the theme covered in this article, here are some UOB Asset Management Funds to consider: United Asia Fund
United Greater China Fund
United SG Dynamic Income Fund
You may wish to seek advice from a financial adviser before making a commitment to invest in the above fund, and in the event that you choose not to do so, you should consider carefully whether the fund is suitable for you. |
MSCI Data are exclusive property of MSCI. MSCI Data are provided “as is”, MSCI bears no liability for or in connection with MSCI Data. MSCI full disclaimer here.
All information in this publication is based upon certain assumptions and analysis of information available as at the date of the publication and reflects prevailing conditions and UOB Asset Management Ltd (“UOBAM”)'s views as of such date, all of which are subject to change at any time without notice. Although care has been taken to ensure the accuracy of information contained in this publication, UOBAM makes no representation or warranty of any kind, express, implied or statutory, and shall not be responsible or liable for the accuracy or completeness of the information.
Potential investors should read the prospectus of the fund(s) (the “Fund(s)”) which is available and may be obtained from UOBAM or any of its appointed distributors, before deciding whether to subscribe for or purchase units in the Fund(s). Returns on the units are not guaranteed. The value of the units and the income from them, if any, may fall as well as rise, and is likely to have high volatility due to the investment policies and/or portfolio management techniques employed by the Fund(s). Please note that the graphs, charts, formulae or other devices set out or referred to in this document cannot, in and of itself, be used to determine and will not assist any person in deciding which investment product to buy or sell, or when to buy or sell an investment product. An investment in the Fund(s) is subject to investment risks and foreign exchange risks, including the possible loss of the principal amount invested. Investors should consider carefully the risks of investing in the Fund(s) and may wish to seek advice from a financial adviser before making a commitment to invest in the Fund(s). Should you choose not to seek advice from a financial adviser, you should consider carefully whether the Fund(s) is suitable for you. Investors should note that the past performance of any investment product, manager, company, entity or UOBAM mentioned in this publication, and any prediction, projection or forecast on the economy, stock market, bond market or the economic trends of the markets is not necessarily indicative of the future or likely performance of any investment product, manager, company, entity or UOBAM or the economy, stock market, bond market or economic trends of the markets. Nothing in this publication shall constitute a continuing representation or give rise to any implication that there has not been or that there will not be any change affecting the Funds. All subscription for the units in the Fund(s) must be made on the application forms accompanying the prospectus of that fund.
The above information is strictly for general information only and is not an offer, solicitation advice or recommendation to buy or sell any investment product or invest in any company. This publication should not be construed as accounting, legal, regulatory, tax, financial or other advice. Investments in unit trusts are not obligations of, deposits in, or guaranteed or insured by United Overseas Bank Limited, UOBAM, or any of their subsidiary, associate or affiliate or their distributors. The Fund(s) may use or invest in financial derivative instruments, and you should be aware of the risks associated with investments in financial derivative instruments which are described in the Fund(s)’ prospectus.
Please visit the following for more details on the funds, important notes and the respective funds’ disclaimers.
United Asia Fund: https://www.uobam.com.sg/our-funds/highlights/united-asia-fund/index.page
United Greater China Fund: https://www.uobam.com.sg/our-funds/highlights/united-greater-china-fund/index.page
United SG Dynamic Income Fund: https://www.uobam.com.sg/our-funds/highlights/united-sg-dynamic-income-fund/index.page
This advertisement has not been reviewed by the Monetary Authority of Singapore.
UOB Asset Management Ltd Co. Reg. No. 198600120Z