
The United Asian High Yield Bond Fund offers investors a strong and steady income stream. But with interest rates on the down trend, the fund has an extra benefit – the potential for good capital gains
Key takeaways
- Asian high yield (HY) bonds returned 9.7% this year, well in excess of other bond categories
- Asian HY default risks are also falling amid solid Asian corporate fundamentals
- Overall, the sector is seeing strong demand from investors seeking both income and potential bond price gains
Interest rates in Singapore and the rest of the region are poised to head lower, especially when the Fed finally reverses its rate hike cycle. Naturally, investors around the world are now expanding their search for yield. One area of intense interest is corporate bonds, given that fears of defaults have lessened amid expectations of good corporate fundamentals over the next few years.
As a result, developed market investment grade (IG) corporate bonds have seen strong flows in May and June. However, another category - high yield (HY) bonds, especially those issued by fast-growing and high-earning Asian corporates - are starting to appeal to global investors as a good diversifier and income enhancer.
Across the global bond universe, Asia HY bonds have outperformed year to date (YTD). Their total return of 9.7 percent dwarves that of both US (3.2 percent) and Europe HY bonds (2.3 percent), as well as its global IG peers.
Fig 1: Total returns by bond category, YTD as of 4 July 2024
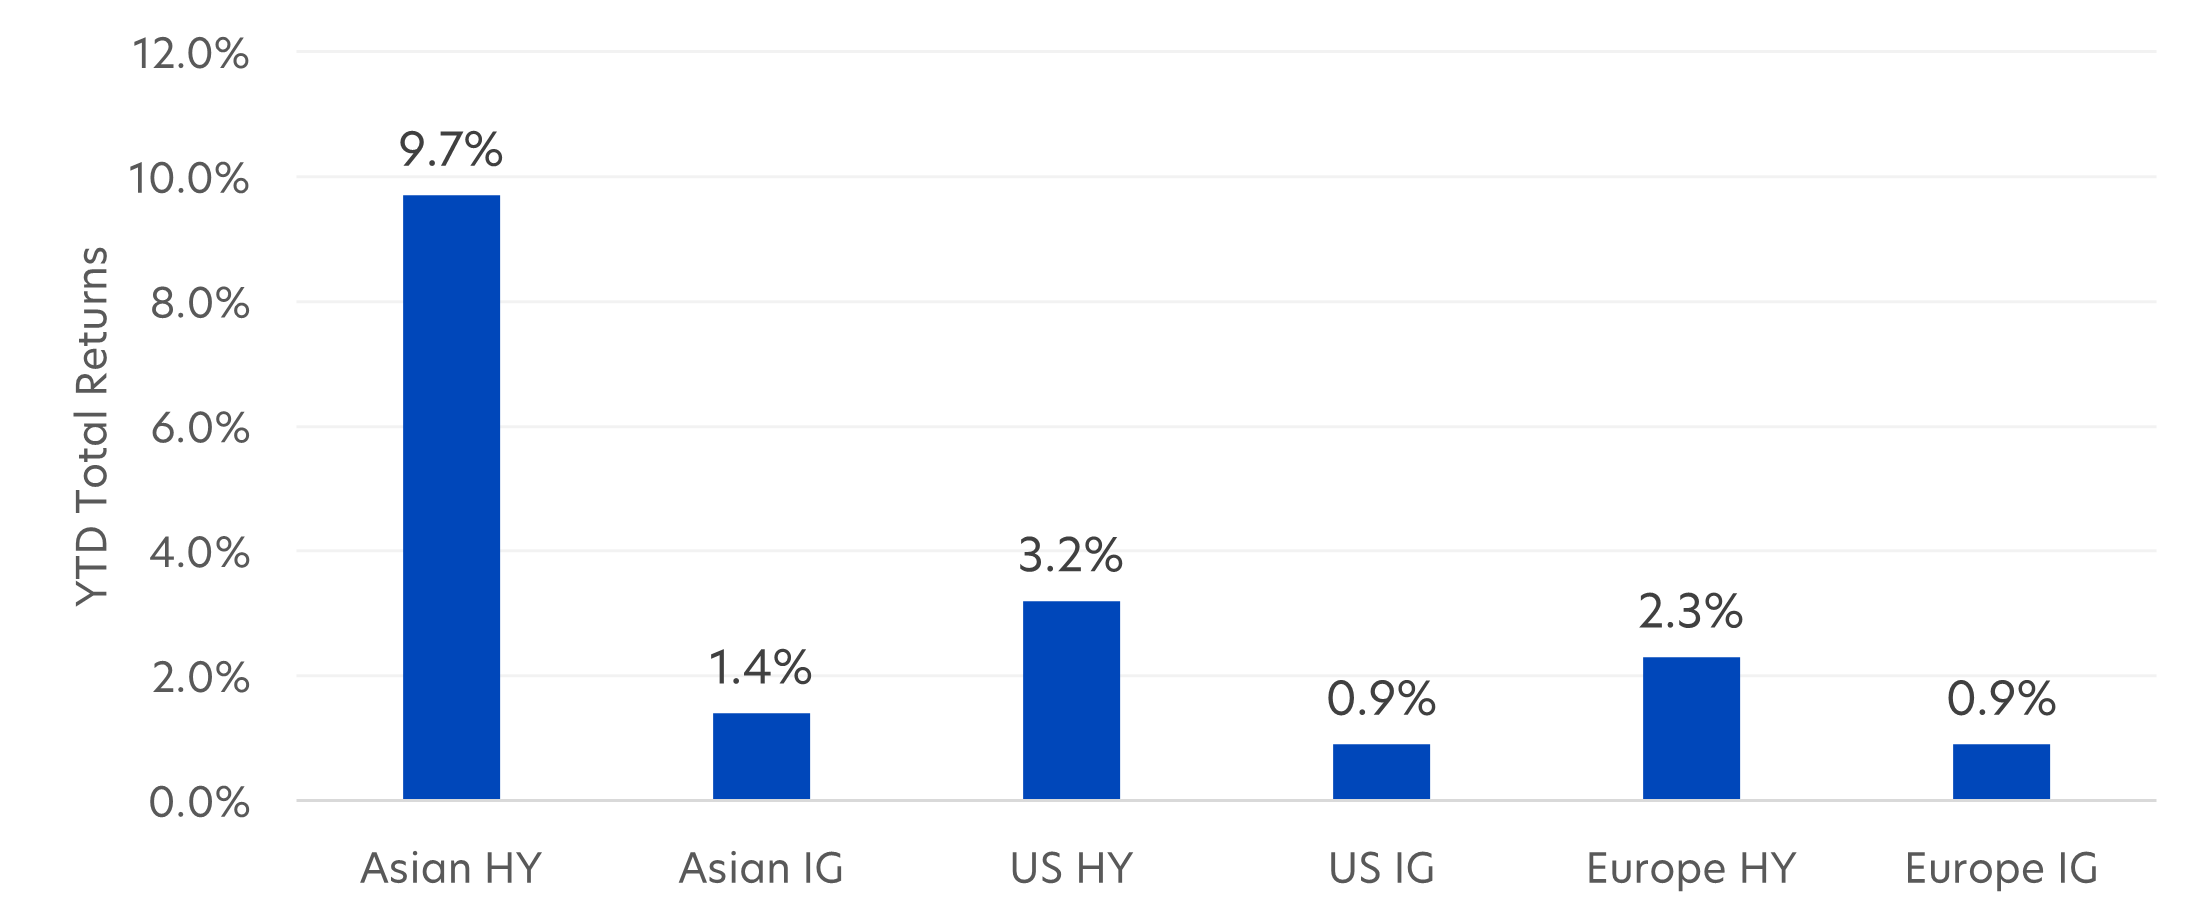
Source: Bloomberg, UOBAM, 4 July 2024. Asian HY: JACI Non-IG Index, Asian IG: JACI IG Index, US HY: ICE BofA US High Yield Constrained Index, US IG: ICE BofA US Corporate Index, Europe HY: ICE BofA Global High Yield European Issuers Constrained Index, Europe IG: ICE BofA Euro Corporate Index
Here’s why Asian high yield bonds deserve a place in income portfolios:
1) Attractive yields
Strong demand and reduced supply have narrowed developed market IG corporate bond spreads (the yield difference between government and IG corporate bonds) to their lowest level in two years. At a time when rates are easing, Asian HY bonds offer yields well in excess of other bond categories – about two times higher than their IG peers, and four times higher than current fixed deposit rates. This makes them an alluring choice for income-hungry investors.
| Average yield | |
| Asian HY bonds | 12.2% |
| Asian IG bonds | 5.3% |
| Singapore fixed deposits | 2.5% |
Source: Bloomberg, UOBAM, 27 June 2024, based on JACI High Yield index and JACI Investment Grade Index
Fixed deposit yield based on the average rate offered by Singapore’s local banks for a 12-month placement (DBS: 3.2%, OCBC: 2.8%, UOB: 1.5%), as of 20 June 2024.
2) Reduced default risk
Asia's economic expansion is gathering pace this year, supported by a rebound in manufacturing and export trends as well as China’s improving growth outlook. This sets the stage for stronger corporate earnings and credit quality from Asian companies. Asia is expected to see year-on-year earnings growth of 20.6 percent in 2024, nearly double the US’s 11.1 percent growth, and five times higher than Europe’s 3.9 percent growth1.
Given these robust fundamentals, the risk of Asia HY bonds defaulting is also diminishing. The default rate for 2024 is estimated at 4.5 percent, down from 9.1 percent in 2023 and 16.8 percent in 2022.
Fig 2: Asia HY bonds default amount & default rate, 2014 – 2024E
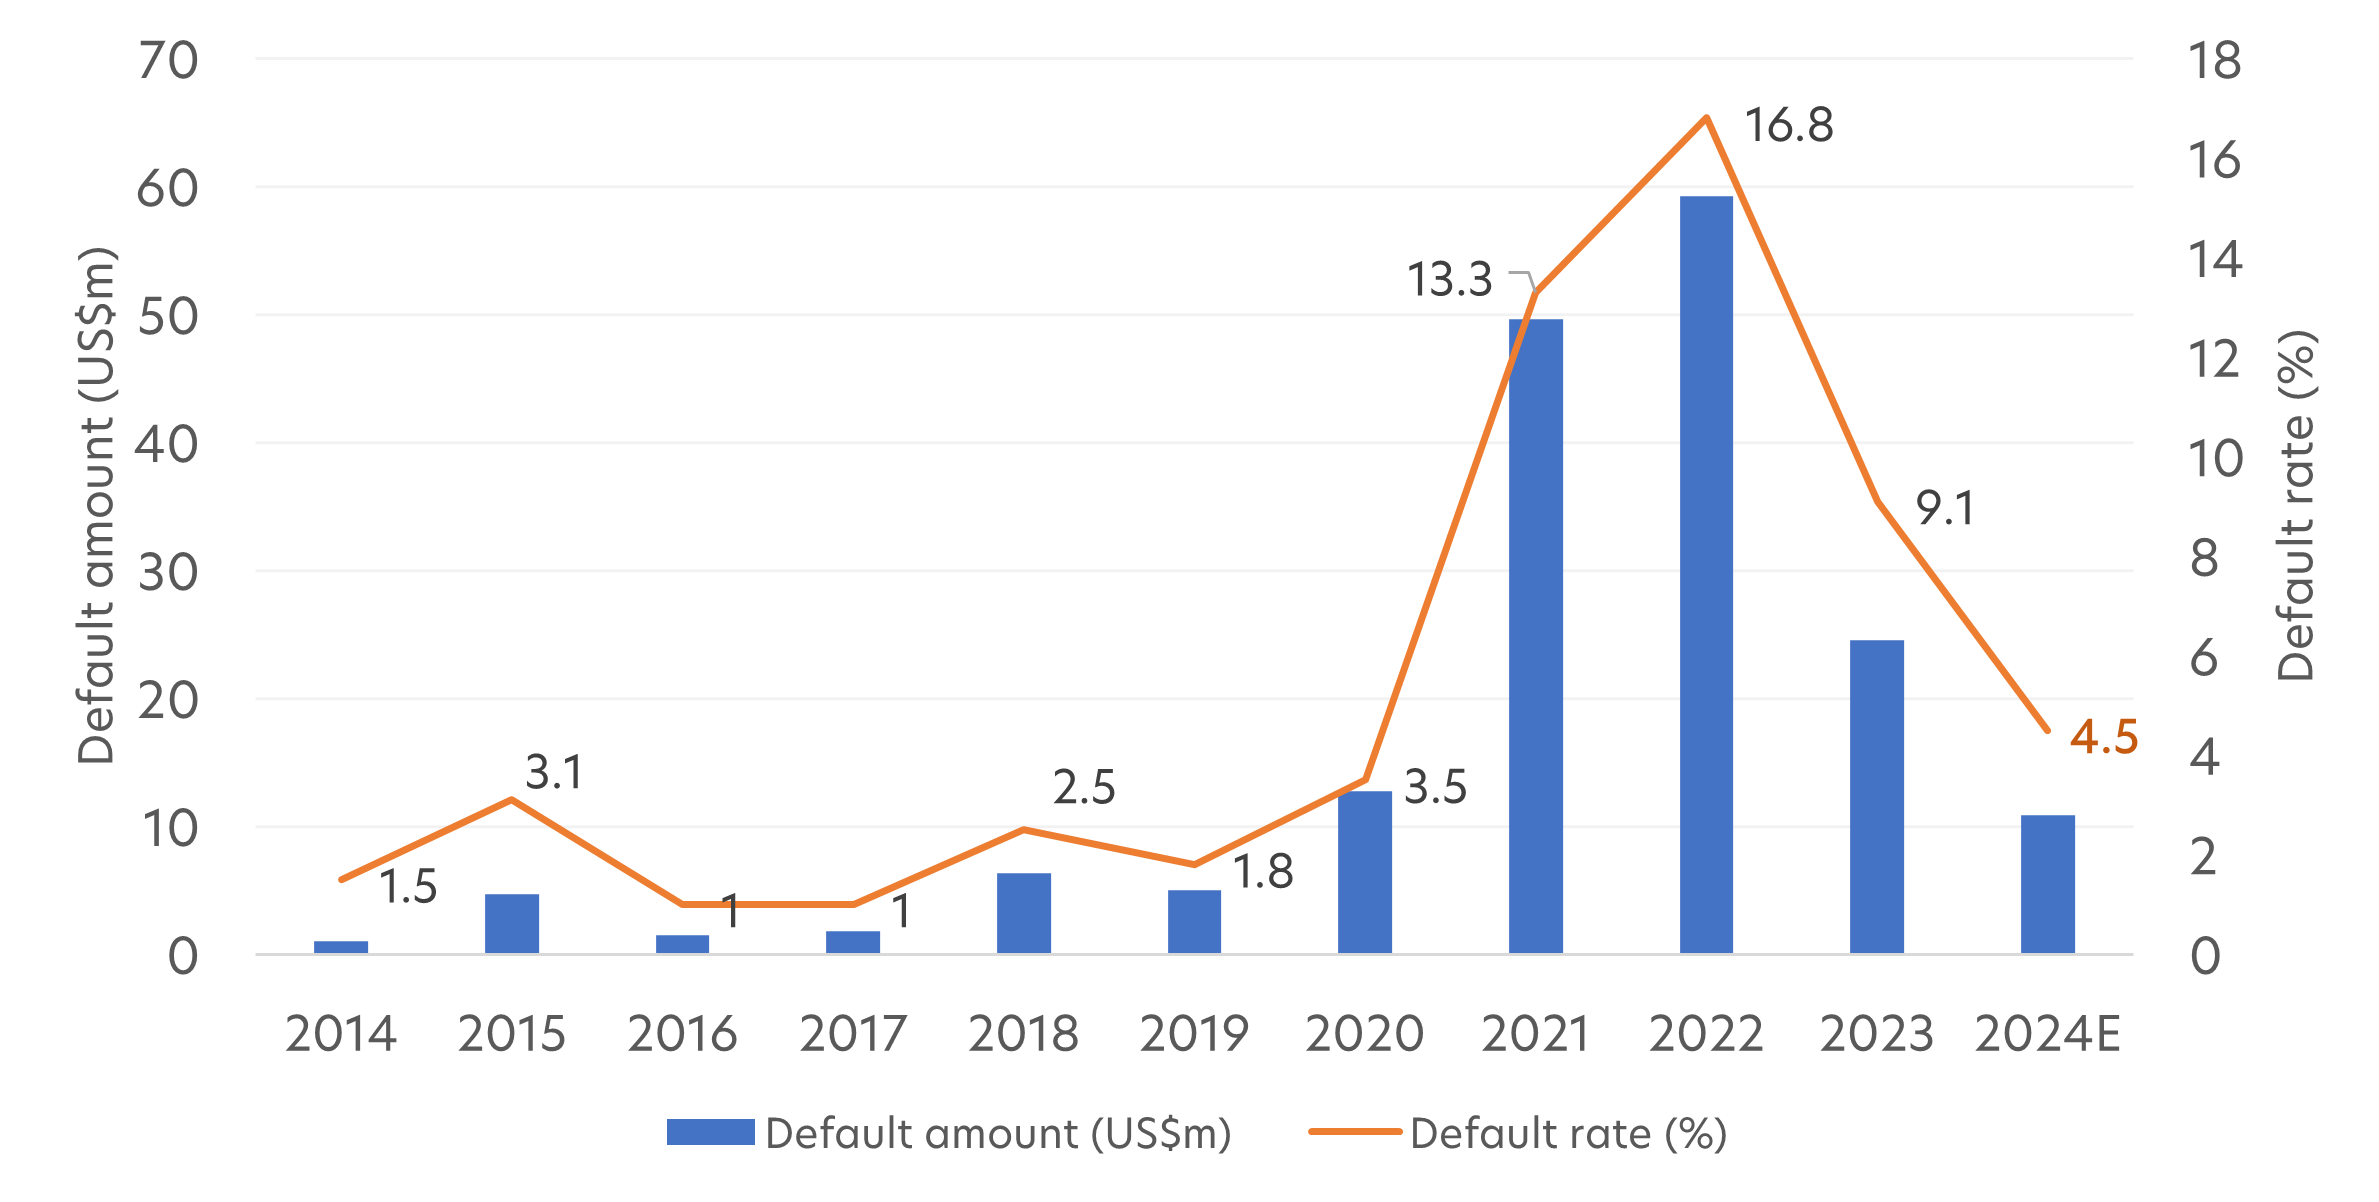
Source: UOBAM, JP Morgan, May 2024
3) Potential for capital gains when rates fall
Bond prices rise when interest rates fall, offering investors good capital gains. Given that the US is set to lower rates, and Asian economies are likely to follow suit, bond prices can be expected to trend upwards. Furthermore, new issuances are likely to remain subdued as issuers wait to see how much lower interest rates can fall, thereby helping to support Asian HY bond prices.
Fig 3: Asia HY bond prices during 2020 interest rate cut cycle
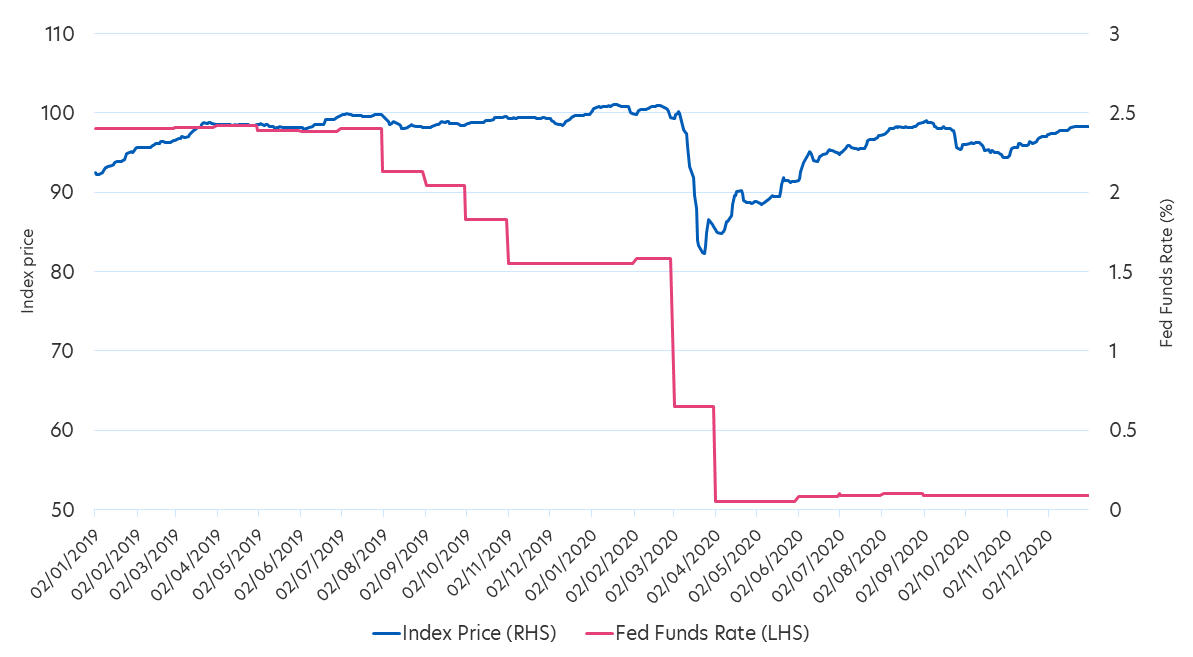
Source: Bloomberg. Index: Bloomberg Asia USD High Yield Bond Index
How much to invest?
To achieve a balance between risk and yields, investors can consider a barbell approach, pairing Asian HY bonds with Asian IG bonds. This allows investors to enjoy the higher income (from their HY holdings) while maintaining portfolio stability (from their IG holdings).
Let’s take, for example, a 70-30 split between Asian IG and HY bonds. For a S$100,000 investment, here is the range of returns investors can expect from a portfolio of Asian HY and IG bonds, versus a standalone investment.
| 1Y total returns (%) | Risk (1Y standard deviation(%)) | Potential growth of S$100,000 over one year | |
| 70% Asian IG, 30% Asian HY | 8.3 | 4.2 | S$104,100 – S$112,500 |
| 100% Asian IG | 6.0 | 3.2 | S$102,800 – S$109,200 |
| 100% Asian HY | 13.7 | 6.5 | S$107,200 – S$120,200 |
Source: UOBAM, Morningstar as of 30 June 2024, based on JACI Investment Grade Index and JACI High Yield Index
The United Asian High Yield Bond Fund
Actively-managed
The United Asian High Yield Bond Fund (“the Fund”) seeks to achieve a total return consisting of high income and capital appreciation by investing primarily in HY bonds issued by Asian entities.
The Fund currently pays a dividend yield of 7.0 percent2, plus generated strong equity-like returns in 2023 and so far this year. Notably, the Fund does not closely track the index. Instead, it generally takes a more defensive stance and as a result, can underperform its benchmark when markets are positive, but outperforms when markets are negative, as can be seen in 2022.
As a result, the Fund is rated 5-star by Morningstar, and is in the top quartile of its Morningstar category for its one-year and three-year performance3.
| YTD 2024 (%) | 2023 (%) | 2022 (%) | |
| Fund | 10.8 | 12.5 | -12.3 |
| Category | 8.4 | -4.9 | -19.2 |
| Benchmark | 13.5 | 3.0 | -15.5 |
Source: Morningstar, as of 30 June 2024, SGD basis, with dividends and distributions reinvested, if any. Fund performance is calculated on a NAV to NAV basis. Performance does not include the effect of charges such as sales or subscription fees, which an investor might or might not pay. Past performance is not necessarily indicative of future performance. Category: Asia High Yield Bond Benchmark. J.P. Morgan Asia Credit Index (JACI) Non-Investment Grade Total Return Index.
Cautious on China developers
By relinquishing most of its holdings in China property sector bonds early on, the Fund did not suffer from the sector’s high number of defaults in 2023. This cautious stance remains despite some initial recovery in the country’s property market. Anticipating further volatility, the Fund only has a very small exposure (4.6 percent)4 to China HY real estate bonds.
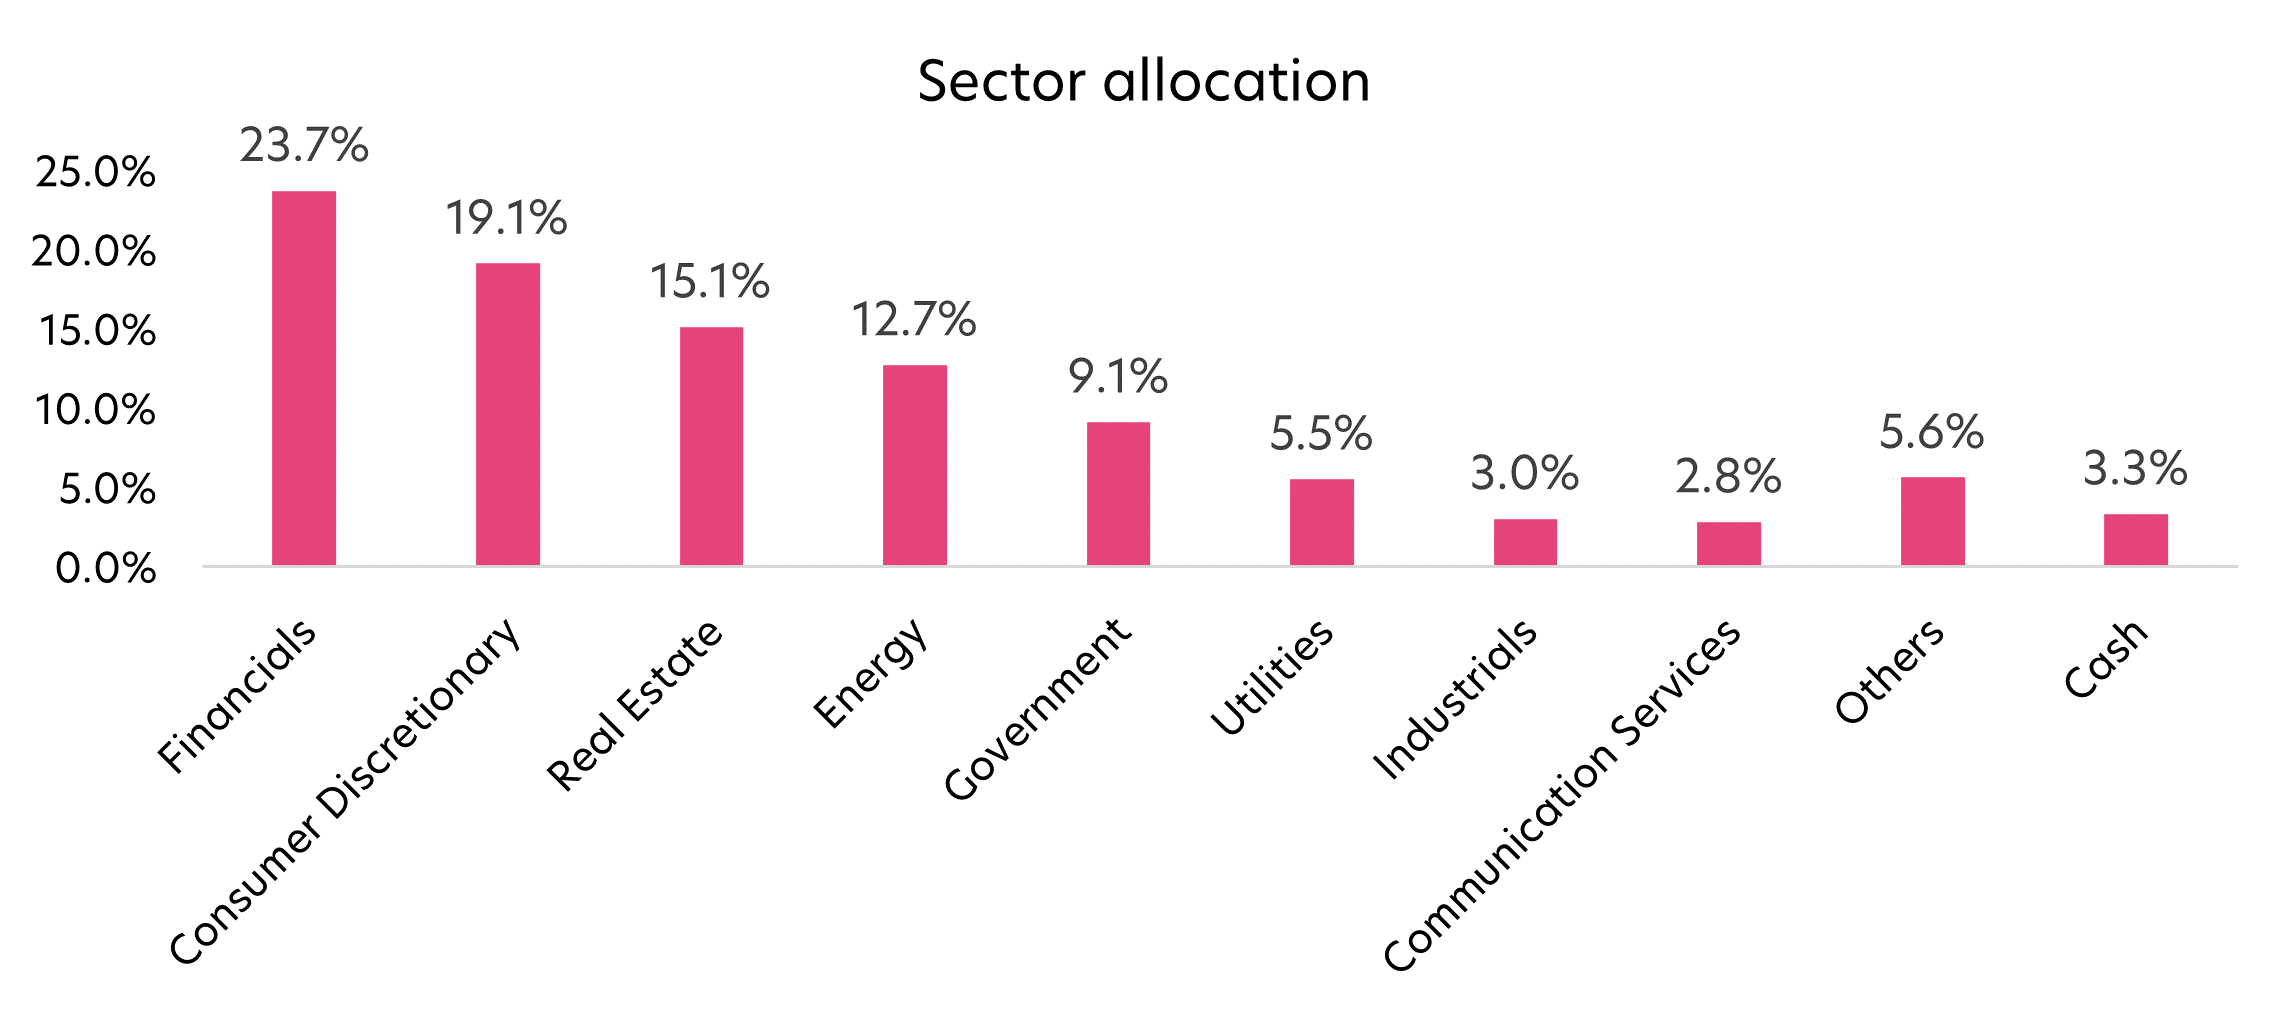
Rather, most of the Fund’s China bond holdings are from Consumer Discretionary, Healthcare, Energy and Utilities companies. The Fund’s largest geographic allocation is to Hong Kong bonds, with a 3 percent allocation to Macau bonds, primarily in the casino and gaming space.
Fig 4: Fund country and sector allocation, as of 30 June 2024
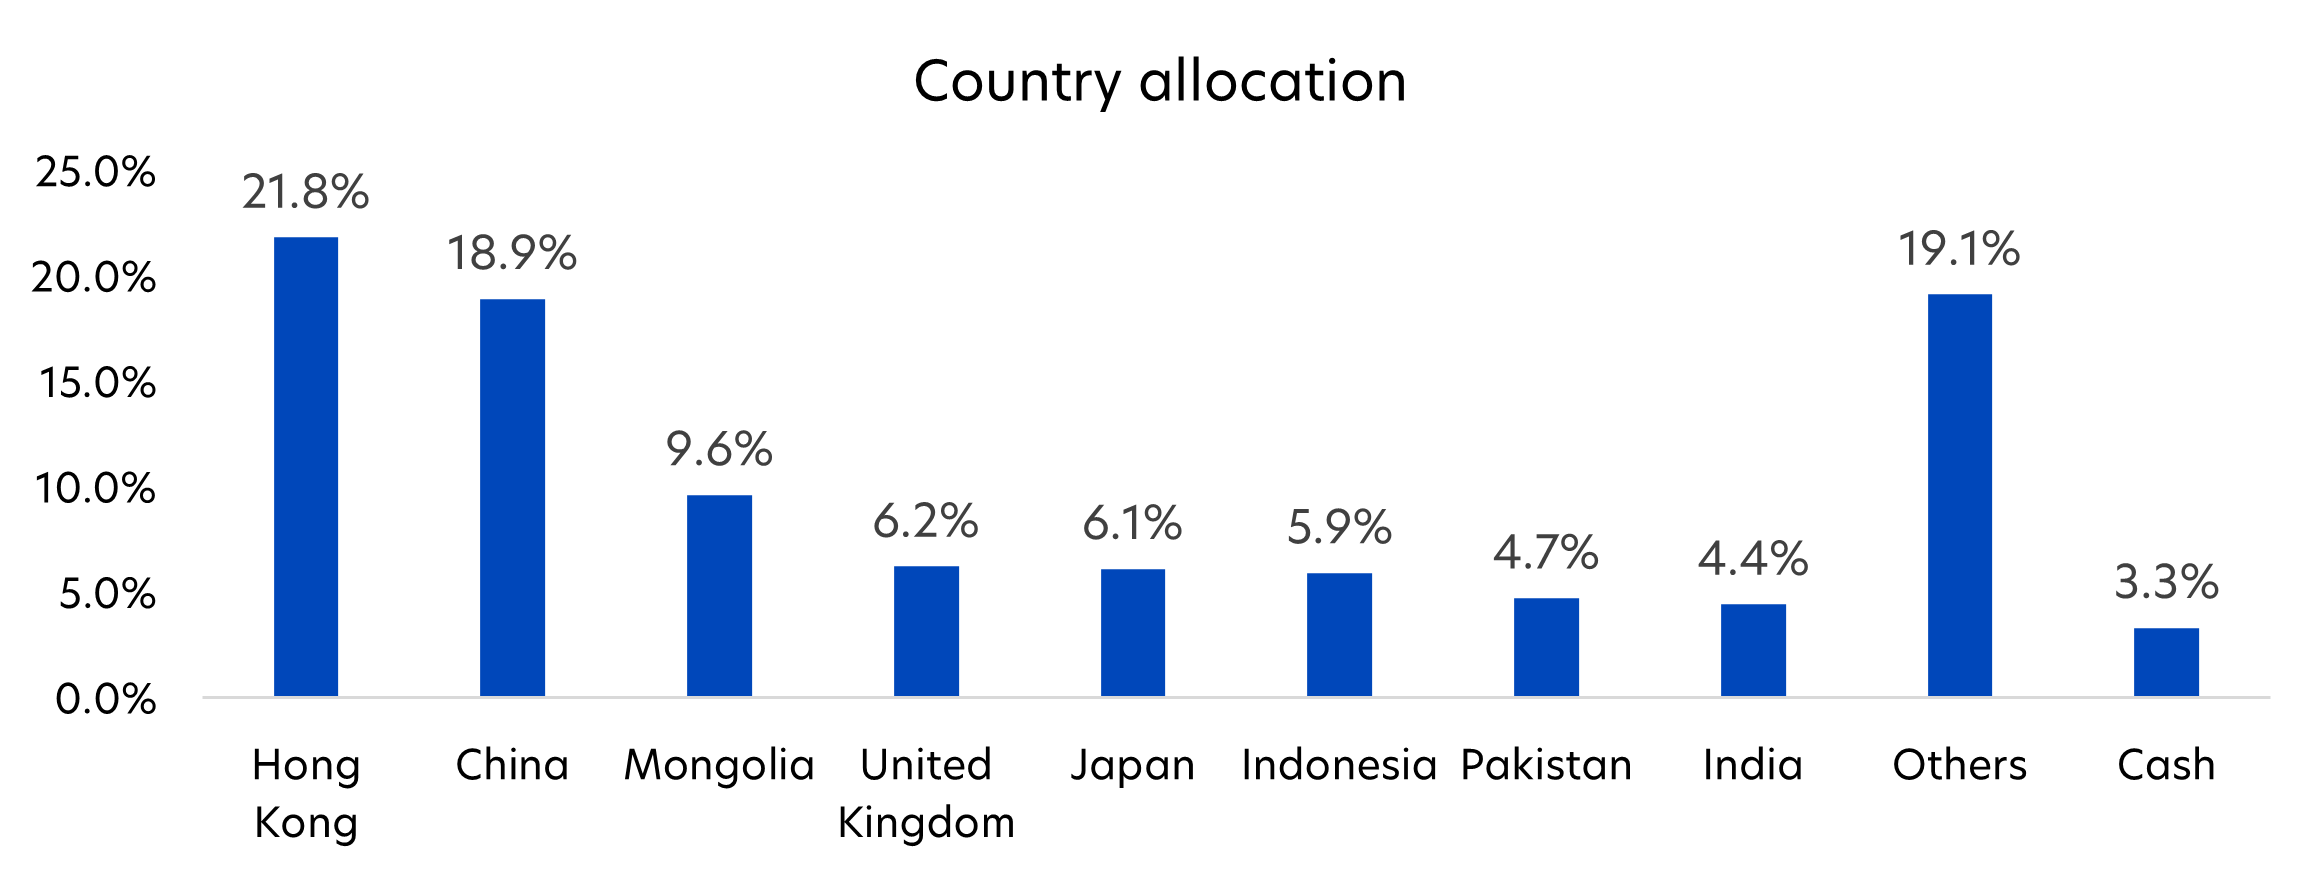
Source: UOBAM, as of 30 June 2024
Higher yield and lower risk5
The Fund has a higher yield but lower risk compared to the benchmark. Its yield to maturity is 9.2 percent, above the average yield of the JACI non-IG index. At the same time, its three-year standard deviation of 9.2 percent is lower than the index’s 13.5 percent. For comparison purposes, the three-year standard deviation for global equities is 22.1 percent6.
Additionally, the Fund has a relatively low duration of 2.3 years. This helps to shield investors from bond price volatility due to interest rate fluctuations.
Overall, the Fund serves as a way for investors to access a steady income stream. It is also capable of delivering returns similar to global equities, but without subjecting investors to similar risk.
Fund details
| United Asian High Yield Bond Fund, as of 30 June 2024 | |
| Fund objective | The United Asian High Yield Bond Fund seeks to achieve a total return consisting of high income and capital appreciation by investing primarily in high yield fixed income or debt securities (including money market instruments) issued by Asian corporations, financial institutions, governments and their agencies. |
| Dividend yield | 7.0%, paid out monthly (Class SGD Dist) Distributions (in SGD) are not guaranteed. Distributions may be made out of income, capital gains and/or capital. This relates to the disclosed distribution policy as set out in the Fund’s prospectus |
| Average duration | 2.3 years |
| Average credit rating | BB- |
| No. of issues | 77 |
| Management fee | Class A SGD Acc Class A SGD Acc (Hedged) Class SGD Dist Class A SGD Dist (Hedged) |
| Management fee | Class A SGD Acc, Class A SGD Acc (Hedged), Class SGD Dist, Class A SGD Dist (Hedged): Currently 1.25% p.a.; maximum 1.25% p.a. |
| Subscription fee | 3% |
| Minimum subscription / trading size | Class A SGD Acc, Class A SGD Acc (Hedged), Class SGD Dist, Class A SGD Dist (Hedged): S$1000 (initial) |
| If you are interested in investment opportunities related to the theme covered in this article, here is a UOB Asset Management Fund to consider: United Asian High Yield Bond Fund
You may wish to seek advice from a financial adviser before making a commitment to invest in the above fund, and in the event that you choose not to do so, you should consider carefully whether the fund is suitable for you. |
1 Source: Source: Factset, UOBAM, as of 15 May 2024
2 Distributions are not guaranteed. Distributions may be made out of income, capital gains and/or capital. This relates to the disclosed distribution policy as set out in the Fund’s prospectus.
3 Source: Morningstar, as of 30 June 2024
4 Source: UOBAM, as of 30 June 2024
5 All fund data as of 30 June 2024. Source: UOBAM
6 Source: Bloomberg, as of 30 June 2024
Distributions will be made in respect of the Distribution Classes of the Fund. Distributions are based on the NAV per unit of the relevant Distribution Class as at the last business day of the month. The making of distributions is at the absolute discretion of UOBAM and that distributions are not guaranteed. The making of any distribution shall not be taken to imply that further distributions will be made. The Managers reserve the right to vary the frequency and/or amount of distributions. Distributions from a fund may be made out of income and/or capital gains and (if income and/or capital gains are insufficient) out of capital. Investors should also note that the declaration and/or payment of distributions (whether out of capital or otherwise) may have the effect of lowering the net asset value (NAV) of the relevant fund. Moreover, distributions out of capital may amount to a return of part of your original investment and may result in reduced future returns. Please refer to the Fund’s prospectus for more information.
All information in this publication is based upon certain assumptions and analysis of information available as at the date of the publication and reflects prevailing conditions and UOB Asset Management Ltd (“UOBAM”)’s views as of such date, all of which are subject to change at any time without notice. Although care has been taken to ensure the accuracy of information contained in this publication, UOBAM makes no representation or warranty of any kind, express, implied or statutory, and shall not be responsible or liable for the accuracy or completeness of the information.
Potential investors should read the prospectus of the fund(s) (the “Fund(s)”) which is available and may be obtained from UOBAM or any of its appointed distributors, before deciding whether to subscribe for or purchase units in the Fund(s). Returns on the units are not guaranteed. The value of the units and the income from them, if any, may fall as well as rise. Please note that the graphs, charts, formulae or other devices set out or referred to in this document cannot, in and of itself, be used to determine and will not assist any person in deciding which investment product to buy or sell, or when to buy or sell an investment product. An investment in the Fund(s) is subject to investment risks and foreign exchange risks, including the possible loss of the principal amount invested. Investors should consider carefully the risks of investing in the Fund(s) and may wish to seek advice from a financial adviser before making a commitment to invest in the Fund(s). Should you choose not to seek advice from a financial adviser, you should consider carefully whether the Fund(s) is suitable for you. Investors should note that the past performance of any investment product, manager, company, entity or UOBAM mentioned in this publication, and any prediction, projection or forecast on the economy, stock market, bond market or the economic trends of the markets is not necessarily indicative of the future or likely performance of any investment product, manager, company, entity or UOBAM or the economy, stock market, bond market or economic trends of the markets. Nothing in this publication shall constitute a continuing representation or give rise to any implication that there has not been or that there will not be any change affecting the Funds. All subscription for the units in the Fund(s) must be made on the application forms accompanying the prospectus of that fund.
The above information is strictly for general information only and is not an offer, solicitation advice or recommendation to buy or sell any investment product or invest in any company. This publication should not be construed as accounting, legal, regulatory, tax, financial or other advice. Investments in unit trusts are not obligations of, deposits in, or guaranteed or insured by United Overseas Bank Limited, UOBAM, or any of their subsidiary, associate or affiliate or their distributors. The Fund(s) may use or invest in financial derivative instruments and you should be aware of the risks associated with investments in financial derivative instruments which are described in the Fund(s)’ prospectus.
This advertisement has not been reviewed by the Monetary Authority of Singapore.
UOB Asset Management Ltd Co. Reg. No. 198600120Z