

Gold prices are rising for many reasons, not least due to the heightened geopolitical tensions globally. But in the recent past, there was a disconnect between gold mining stocks and gold prices. This is now changing
Gold in a fractured world
Tensions in the Middle East have flared up again amid the ongoing conflicts in Gaza and the recent Iran-Israel conflict. Although the tit-for-tat attacks between Iran and Israel look unlikely to escalate for now, there is now a greater scope for adverse surprises across the region.
Gold prices had already been trending up prior to these events, with gains of about 8.0 percent in 2023. However, mounting geopolitical risks have caused gold prices to further accelerate since March this year, and prices have jumped by more than 11 percent in the past seven weeks.
Fig 1: Gold prices, 7 Dec 2023 – 23 April 2024 (US$/oz)
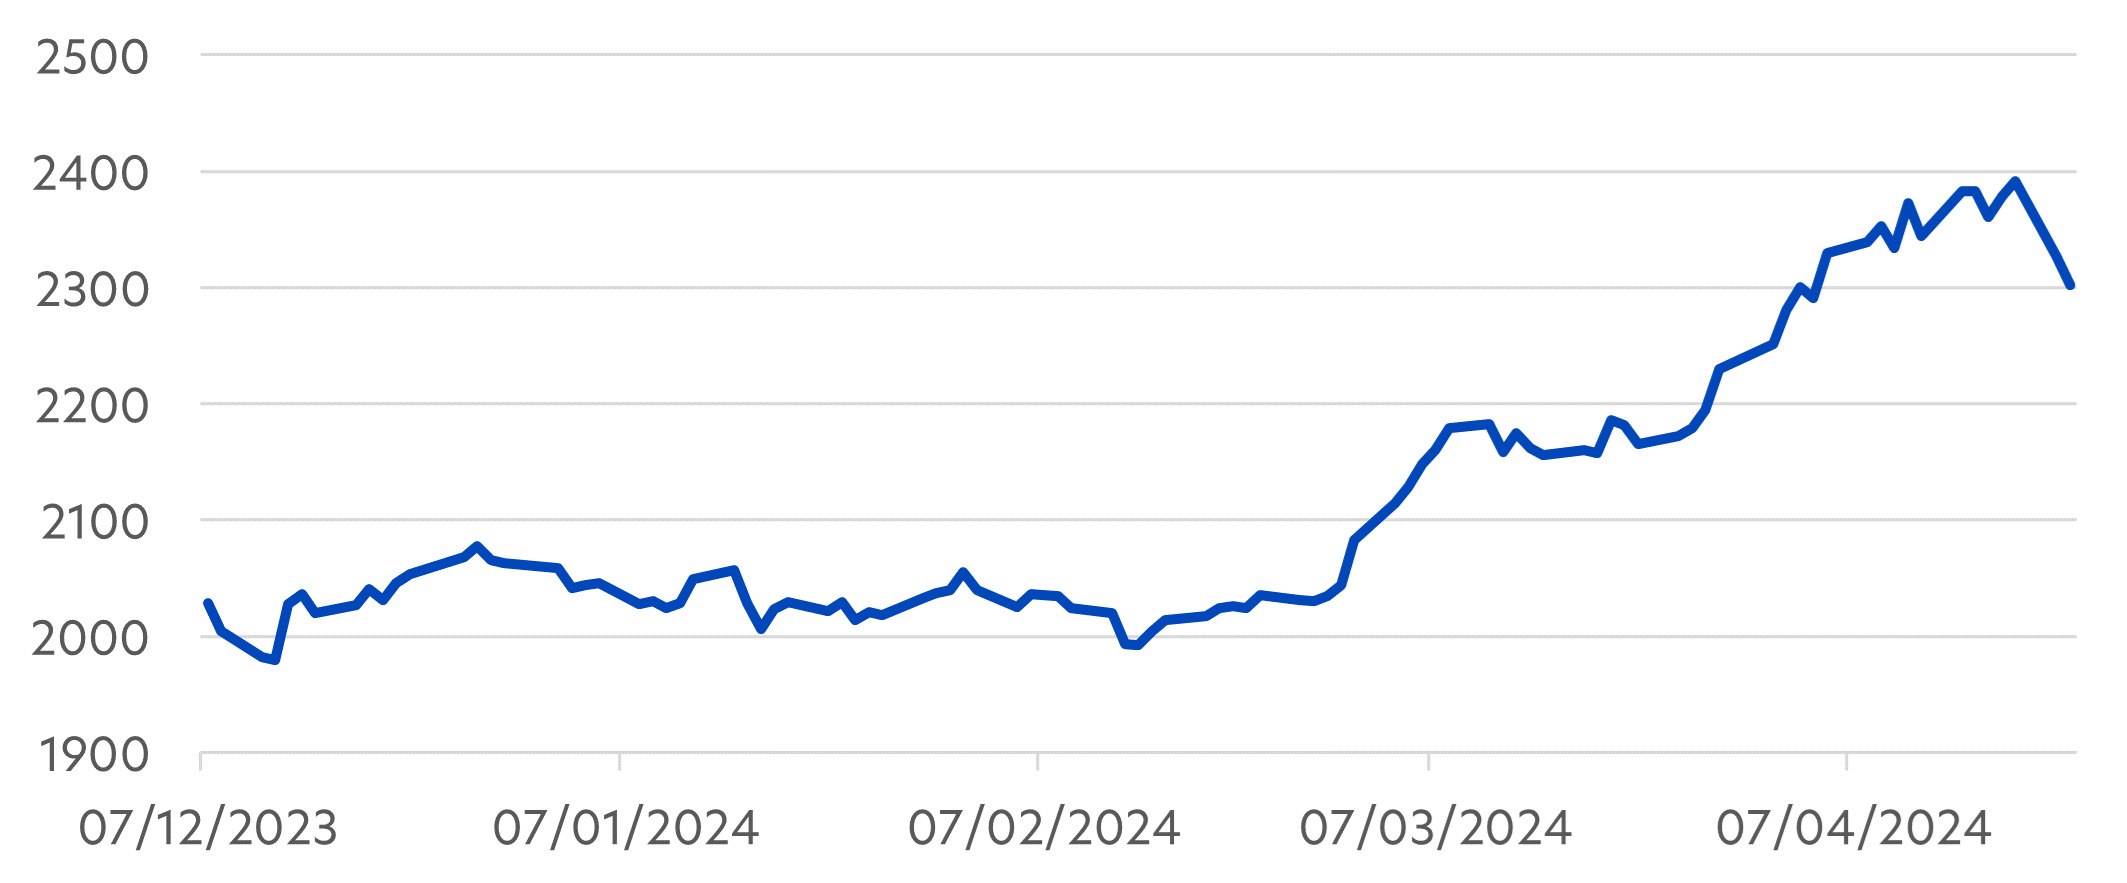
Source: Bloomberg/UOBAM, 24 April 2024.
Gold rally set to continue
Although Iran and Israel have so far appeared to have stepped away from a full-scale war, UOBAM analysts see gold remaining in demand. And if tensions escalate further, gold prices could see a substantial upswing in the coming months. Three key factors are behind this:
1. A hedge against crises
Investors have long shown to have gravitated to gold during times of global crisis, especially when it is likely that both bond and equity investments will be affected adversely. We saw this in 2018 and 2022, and many investors expect this to be the case in 2024. Current concerns about persistent inflation and rate cut delays have already caused bond prices to weaken. In the event of a full-scale Middle East war, oil prices would be expected to surge, further pushing up inflationary pressures and severely impacting both equities and bonds.
2. Effective diversifier
Even in ‘normal’ times, gold prices tend to react to events in a different way than other traditional investment assets such as equities or bonds. Given its finite supply, gold has shown to be a more reliable store of value in inflationary conditions i.e. when currencies are declining in value. However, gold does not pay interest income, and hence might be less attractive to investors when interest rates are high. This makes gold a potentially effective way to help stabilise investment returns.
3. Central bank buying
Gold price rises in recent years have also been driven by central bank buying. At a time of rising global economic uncertainties and structurally higher inflation, many central banks are buying gold to reduce their reliance on the US dollar. This buying spree was particularly prominent in 2022 and 2023 and is not expected to ease in coming years.
Fig 2: Central bank net gold purchases (in tonnes), 2010 – 2023
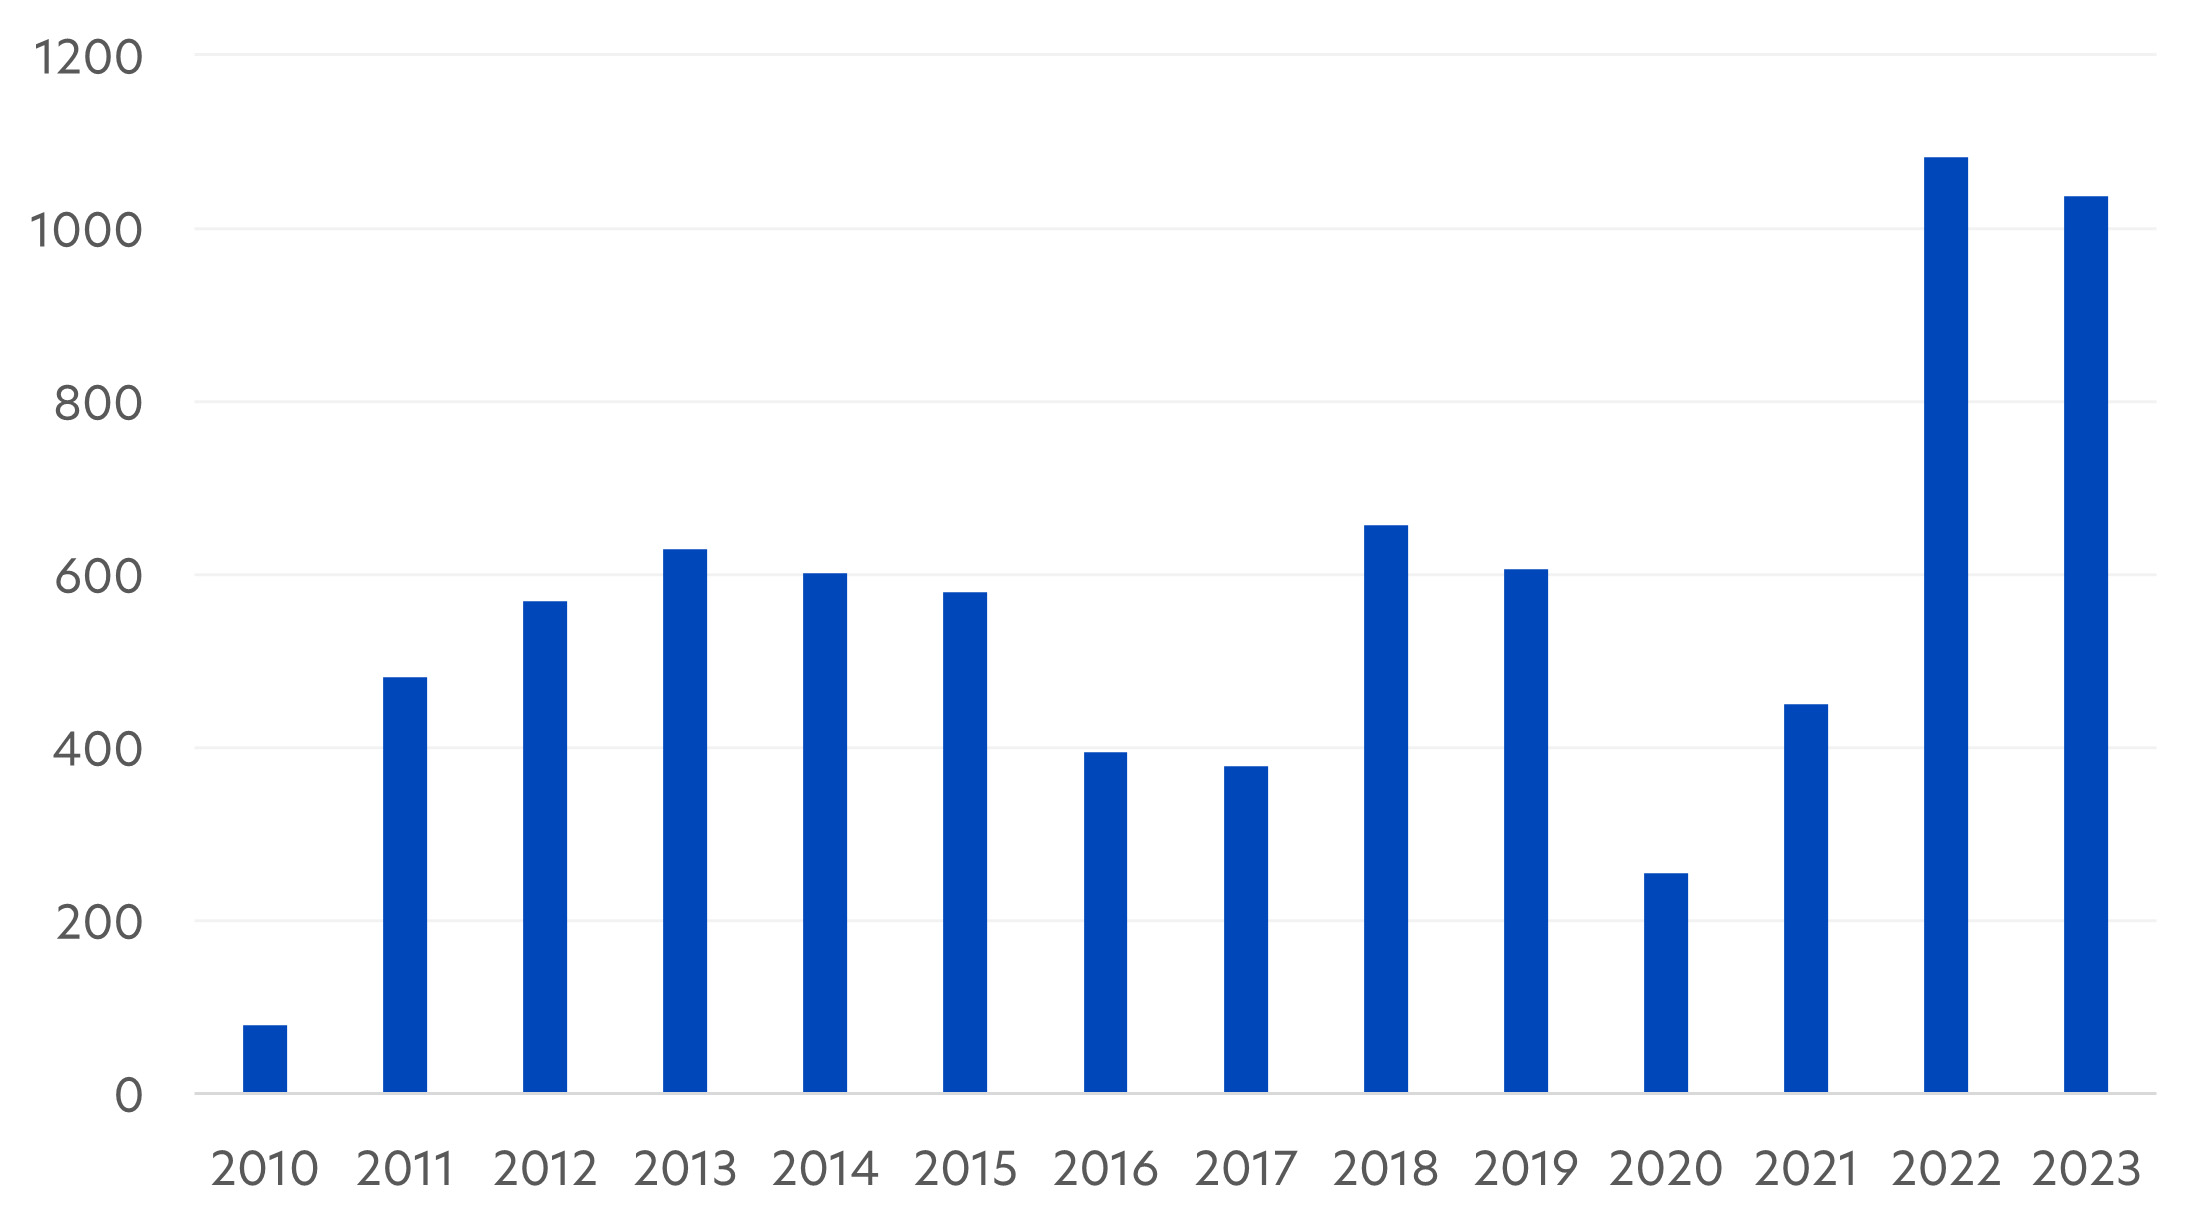
Source: World Gold Council, 24 April 2024
High prices a boost for gold mining stocks
Gold mining companies have traditionally provided a form of leveraged exposure to gold prices. This is because higher gold prices typically translate to higher cash flows and profit margins for gold miners. As a result, gold mining companies' stock returns have demonstrated tendencies to outperform gold price gains, as we observed in 2019 and are seeing signs of now.
In the past few years, this trend seemingly reversed, and gold mining stocks have instead lagged gold prices. Investors were concerned about gold mining companies’ profits margins, given increases in mining wages, machinery costs and exploration expenses.
These concerns are now abating as inflation continues to ease and the outlook for cost control improves. Meanwhile, elevated gold prices will help strengthen company cashflows. An increase in gold company mergers and acquisitions should also lead to better share price performances. As a result of this higher confidence, the gold mining index outperformed gold prices by about 10 percent in March, and about 5 percent in April. Going forward, we anticipate a reversion-to-the-mean with gold miners once again well-positioned to leverage higher gold prices.
Fig 3: Gold price return vs gold mining stocks return (%), 2019 – Apr 2024
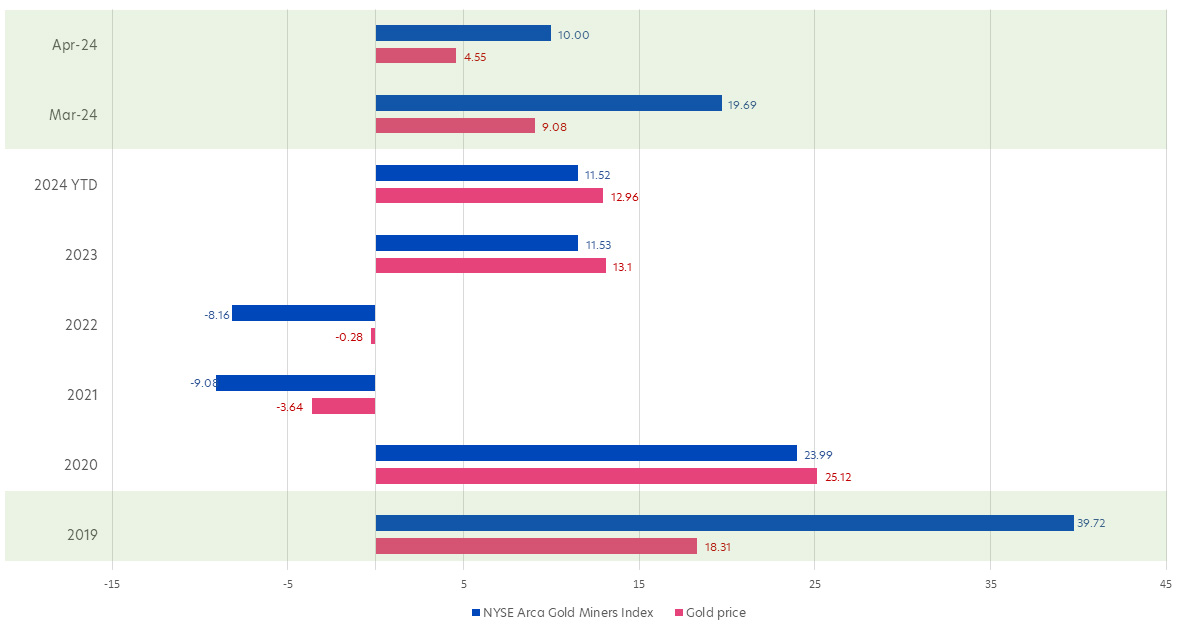
Source: Bloomberg/UOBAM, as of 29 April 2024
United Gold and General Fund
The United Gold and General Fund (the “Fund”) aims to provide capital gains by investing primarily in gold mining companies. For added diversification, the Fund also holds stocks of companies that mine other precious metals and commodities.
Quality mining companies
Given that gold mining is a complex business, the Fund’s portfolio manager seeks out companies that have solid fundamentals and a sound strategy for delivering growth. This can be through strategic discovery and development of gold resources, cost control initiatives, and / or disciplined acquisitions of other gold companies or assets. The portfolio manager believes that such companies will be able to translate higher gold prices into improved cash flow and higher returns over the longer term.
The Fund invests in some of the largest mining companies worldwide. For instance, the Fund invests in Newmont Corp, which recently closed its $15 billion acquisition of Newcrest Mining. Another holding is Agnico Eagle Mines, now the world’s third-largest gold miner after a spate of acquisitions over the past few years.
Fig 4: Fund top 10 holdings, as of 31 Mar 2024
| Company name | Weight (%) | Description |
| Barrick Gold | 9.46 | Mining company that produces gold and copper with 16 operating sites in 13 countries |
| Agnico Eagle Mines | 9.26 | World’s third-largest gold miner |
| Gold Fields | 6.30 | One of the world's largest gold mining firms |
| Newmont Corp | 6.26 | World's largest gold mining corporation and a producer of copper, silver, zinc and lead |
| Northern Star Resources | 5.79 | Australian gold mining company with operations in Western Australia, Northern Territory and Alaska |
| Evolution Mining | 5.64 | Australian gold mining company with operations in Australia and Canada |
| Rio Tinto | 4.89 | World's second-largest metals and mining corporation |
| Teck Resources | 4.49 | Canada’s largest diversified mining company |
| Oceanagold Corp | 4.07 | Gold and copper producer with operations in the US, Philippines, and New Zealand |
| Alamos Gold | 3.89 | Canadian gold mining company with operations in Canada and Mexico |
Fund performance
In March 2024, the Fund delivered returns of 18.90 percent, compared to 17.20 percent for its benchmark. Its net return over the past five years is 7.91 per annum.
Fig 5: Fund returns
| Cumulative performance | Annualised performance | |||
| 1 month | Year-to-date | 3-years | 5-years | |
| United Gold & General Fund | 18.90% | 0.69% | 1.69% | 8.80% |
| Fund (Charges applied^) | 14.15% | -3.34% | -3.89% | 7.91% |
| Benchmark | 17.20% | 0.41% | 0.86% | 8.97% |
Benchmark: 70 percent FTSE Gold Mines Index and 30 percent MSCI ACWI Metals & Mining Index
Source: Morningstar. Fund performance is calculated on a NAV to NAV basis, SGD basis, with dividends and distributions reinvested, if any. Performance as of 31 March 2024.
Performance figures for 1 month and Year-to-Date show the per cent change, while performance figures for 3 and 5 years show the average annual compounded returns.
^Includes the effect of the current subscription fee that is charged, which an investor might or might not pay
Looking ahead, gold prices are poised to remain elevated and gold miners remain undervalued. This means gold stocks have the potential to catch up with gold prices and positions the Fund favourably.
Fund Details
| United Gold & General Fund, as of 31 March 2024 | |
| Investment objective | Achieve returns on investment mainly in securities of corporations whose business is or is substantially in the mining or extraction of gold, silver or precious metals, bulk commodities, base metals of all kinds, and other commodities and it includes the mining or extraction of oil, gas, coal, alternative energy or other commodities or other minerals. |
| Top 5 country allocation (%) | Canada: 44.53 United States: 16.43 Australia: 16.07 United Kingdom: 6.92 South Africa: 6.87 |
| Top 5 sector allocation (%) | Gold: 69.39 Diversified Metals & Mining: 11.34 Silver: 4.99 Steel: 4.77 Copper: 4.09 |
| Fund class available | SGD Acc A |
| Management fee | 1.50% p.a. |
| Subscription fee | Up to 4% p.a. |
| Minimum subscription / trading size | S$1000 (initial); S$500 (subsequent) |
| If you are interested in investment opportunities related to the theme covered in this article, here is a UOB Asset Management Fund to consider: United Gold & General Fund You may wish to seek advice from a financial adviser before making a commitment to invest in the above fund, and in the event that you choose not to do so, you should consider carefully whether the fund is suitable for you. |
MSCI Data are exclusive property of MSCI. MSCI Data are provided “as is”, MSCI bears no liability for or in connection with MSCI Data. MSCI full disclaimer here.
This document is for general information only. It does not constitute an offer or solicitation to deal in units in the Fund (“Units”) or investment advice or recommendation and was prepared without regard to the specific objectives, financial situation or needs of any particular person who may receive it. The information is based on certain assumptions, information, and conditions available as at the date of this document and may be subject to change at any time without notice. No representation or promise as to the performance of the Fund or the return on your investment is made. Past performance of the Fund or UOB Asset Management Ltd (“UOBAM”) and any past performance, prediction, projection or forecast of the economic trends or securities market are not necessarily indicative of the future or likely performance of the Fund or UOBAM. The value of Units and the income from them, if any, may fall as well as rise. Investments in Units involve risks, including the possible loss of the principal amount invested, and are not obligations of, deposits in, or guaranteed or insured by United Overseas Bank Limited (“UOB”), UOBAM, or any of their subsidiary, associate, or affiliate (“UOB Group”) or distributors of the Fund. The Fund may use or invest in financial derivative instruments, and you should be aware of the risks associated with investments in financial derivative instruments which are described in the Fund’s prospectus. The UOB Group may have interests in the Units and may also perform or seek to perform brokering and other investment or securities-related services for the Fund. Investors should read the Fund’s prospectus, which is available and may be obtained from UOBAM or any of its appointed agents or distributors, before investing. You may wish to seek advice from a financial adviser before making a commitment to invest in any Units, and in the event that you choose not to do so, you should consider carefully whether the Fund is suitable for you. Applications for Units must be made on the application forms accompanying the Fund’s prospectus.
This advertisement has not been reviewed by the Monetary Authority of Singapore.
UOB Asset Management Ltd. Co. Reg. No. 198600120Z

Investment Perspective | Aim for alternative assets
With the Middle East conflict likely to continue to simmer, investors should take the opportunity to hedge against increased volatility